Great Post by David Warlick
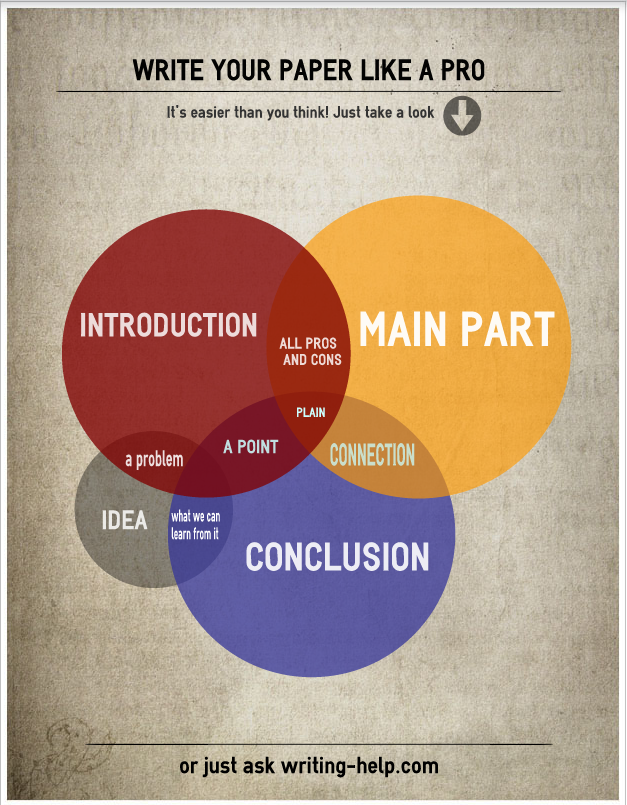
Today’s infographic is simple and to the point. A big part of grade school and even college and onward, is writing papers. Some professions write more papers than others, but it is still an important skill in order to get your point across. This infographic uses venn diagrams to convey the importance of different parts of papers, and to show how they interact with one another. It also shows how much of your paper should include each part.
Of course every paper should begin with an introduction and end with a conclusion. It should also include several point in the middle, that are introduced and concluded in the introduction and conclusion. But how should the middle be laid out? That is up to the author, but it should there is a bit of a formula.
This infographic does a great job of showing that there should be pros and cons. You should always share how your paper may be argued against, and go ahead and prove some of these points wrong. In addition, a good paper should show why the information is important. Why should someone read your paper?
Show this to your students whenever a paper is assigned. Make sure your students are ready to write a good paper, and know what is involved in writing such a paper.